International Iron Ore Trade Industry Analysis: Resource Distribution, Price Trends and Trade Flows
“As the fundamental raw material for the steel industry, iron ore exhibits markedly uneven global distribution. Currently, the world's proven iron ore reserves stand at approximately 180 billion tons, concentrated in a few resource-rich countries.”
I. Global Iron Ore Resource Distribution Pattern
As the fundamental raw material for the steel industry, iron ore exhibits markedly uneven global distribution. Currently, the world's proven iron ore reserves stand at approximately 180 billion tons, concentrated in a few resource-rich countries. Australia leads globally with 48 billion tons of reserves, accounting for 27% of the world's total, primarily located in the hematite deposits of the Pilbara region. Brazil follows closely with 34 billion tons (19%), renowned for its high-quality hematite from the "Iron Quadrangle" region and the Carajás mine. Russia (25 billion tons), China (20 billion tons), and India (7 billion tons) rank third to fifth, forming the "first tier" of global iron ore resources.
In terms of ore quality, iron ore from Australia and Brazil has the highest average grade (typically between 55%-65%), while ore from China, India, and other countries tends to be lower grade (mostly in the 30%-50% range), requiring additional beneficiation processes to meet smelting standards. This disparity in resource endowment directly impacts mining costs and international competitiveness. Notably, the development of the Simandou iron ore project in Guinea, West Africa (estimated reserves of 2.4 billion tons, average grade of 65%), could reshape the current landscape, as it is poised to become the world's largest undeveloped high-grade iron ore deposit.
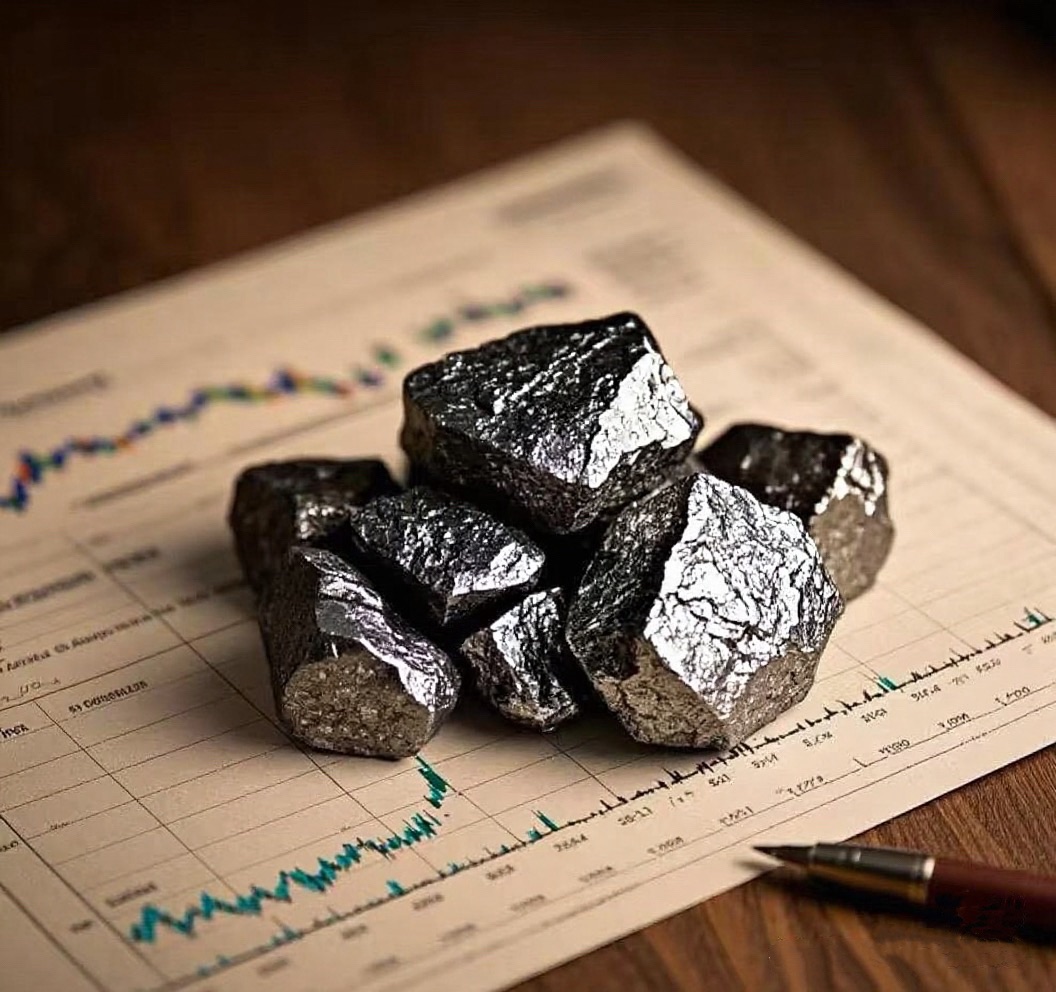
II. Iron Ore Price Dynamics and Influencing Factors
Iron ore prices experienced significant volatility between 2020 and 2023. The Platts 62% Fe index surged from $90 per ton in early 2020 to a historic high of $230 in May 2021, before retreating to a range of $100-$120 in 2023. This price fluctuation is driven by three main factors:
1.Supply-Demand Dynamics: China, accounting for over 55% of global steel production, directly influences prices through its demand fluctuations. The 2021 price spike resulted from a combination of China's post-pandemic economic stimulus-driven demand surge and supply disruptions in Brazil.
2.Cost Structure Differences: Major miners in Australia and Brazil (FMG, Rio Tinto, BHP, Vale) have C1 cash costs of $20-$30 per ton, while Chinese mines average $60-$80, establishing a price floor.
3.Increasing Financialization: Trading volumes of iron ore futures on the Singapore Exchange and Chicago Mercantile Exchange now exceed physical trade volumes by tenfold, with financial capital amplifying price volatility.
A notable trend emerging in 2023 is the shift in pricing mechanisms: approximately 35% of transactions now use index-linked monthly pricing, 15% rely on spot pricing, while traditional annual long-term contracts have fallen below 50%, reflecting a more flexible and transparent market.
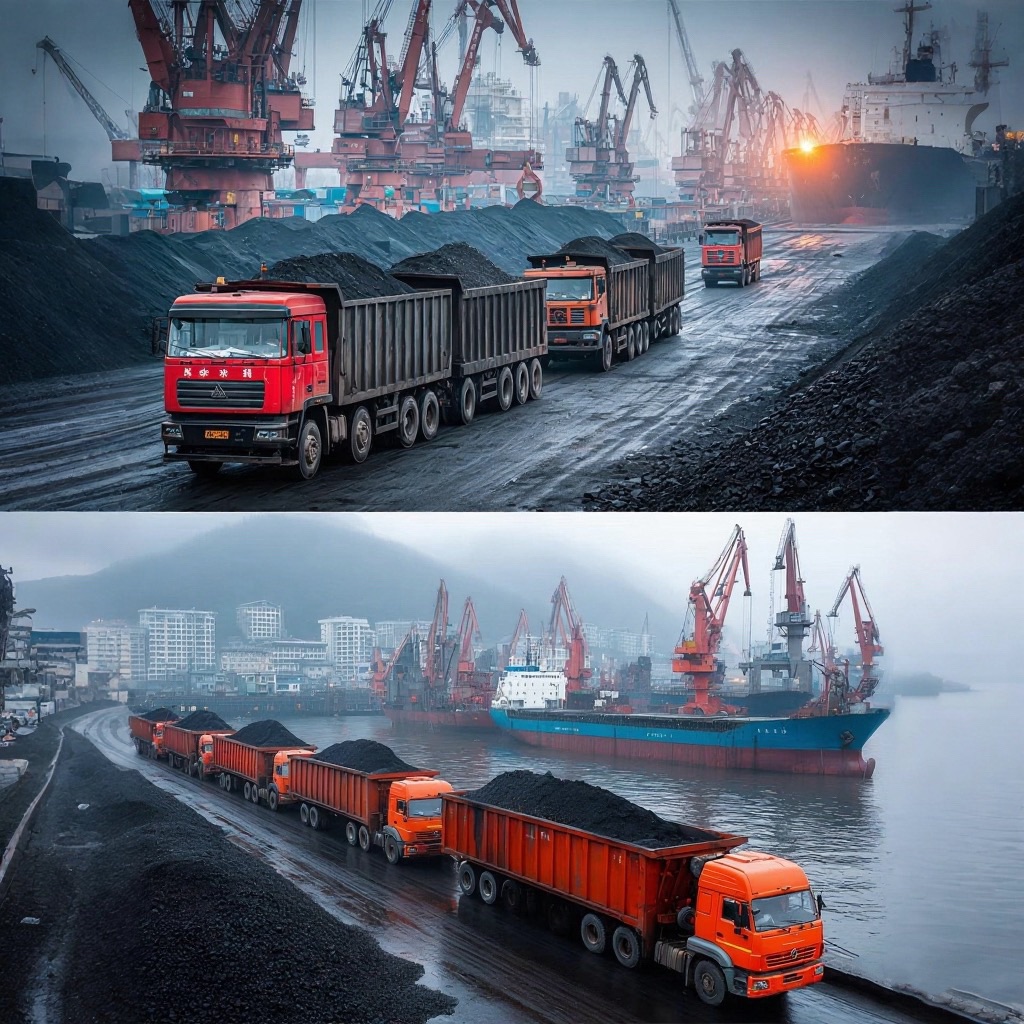
III. Current State of Global Iron Ore Import and Export Trade
Global iron ore trade reached approximately 1.6 billion tons in 2023, marking a 10.3% increase from pre-pandemic levels (1.45 billion tons in 2019), demonstrating steady expansion. Australia remains the top exporter with 870 million tons (54%), followed by Brazil with 340 million tons (21%), together contributing three-quarters of global trade. South Africa (68 million tons), Canada (52 million tons), and Ukraine (pre-war exports of about 40 million tons) form the second-tier exporting nations.
On the import side, China's dominance continues to strengthen, with imports reaching 1.17 billion tons (73% of total trade) in 2023, up 4.5% year-on-year. Other major importers include Japan (110 million tons), South Korea (75 million tons), and the EU (collective imports of 95 million tons). Notably, Southeast Asian countries show significant import growth, with Vietnam (32 million tons, +18%) and Indonesia (21 million tons, +25%) emerging as new demand hotspots.
Trade policies are also evolving: India increased its iron ore export tariff from 30% to 50% in 2022, causing exports to plummet by 60%. Meanwhile, Russia, responding to Western sanctions, has aggressively expanded into the Chinese market with a 15% export discount, achieving 37% year-on-year export growth to China in 2023.
IV. In-Depth Analysis of International Iron Ore Trade Flows
Global iron ore trade flows have formed a complex, multi-directional network centered on East Asia. Here, we analyze three key dimensions: shipping routes, transportation costs, and regional trade agreements.
4.1 Major Shipping Routes and Logistics Hubs
The Australia-China route, the world's busiest iron ore corridor, transports about 580 million tons annually, primarily using Capesize (180,000 DWT) and Very Large Ore Carriers (VLOCs, 400,000 DWT). A typical voyage from Hedland to Qingdao takes approximately 11 days, with freight costs accounting for 8-12% of total expenses.
The Brazil-East Asia route is considerably longer, with a 45-day voyage from Tubarão to Qingdao. However, thanks to the scaled operation of Valemax-class vessels (400,000 DWT), unit transportation costs have dropped from $22 per ton in 2015 to around $15 in 2023. Notably, about 65% of Brazil's iron ore undergoes transshipment or blending at Malaysian hubs like Johor Port.
The emerging West Africa-Asia route is gaining traction, with a 35-day voyage from Guinea to China. Once the Simandou project commences, it is expected to create a new logistics channel of 120 million tons annually, potentially altering existing trade flow patterns.
4.2 Regional Trade Flow Characteristics
The Asia-Pacific region exhibits a highly centralized radial structure: 91% of Australia's exports go to China, while 5% flow to Japan and South Korea. China's import sources are diversified but asymmetrical: 64% from Australia, 21% from Brazil, and 7% from South Africa.
Atlantic trade is more complex: Brazil's exports to Europe have declined from 35% in 2015 to 18% in 2023, while its share to Asia has risen to 76%. Northern European countries rely mainly on short-sea shipping from Sweden (Kiruna mine) and Russia (pre-war), benefiting from lower transportation costs.
New cross-flows are noteworthy: Indian iron ore is shifting to the Middle East (Oman Steel Plant imports 8 million tons annually) and Vietnam; Russia has successfully redirected 30 million tons/year previously bound for the EU to China and Turkey; Canada is increasing supplies to Germany (up by 2 million tons/year) via the St. Lawrence Seaway.
4.3 Evolving Trade Flow Trends
①Nearshoring Trend: The EU aims to reduce reliance on Brazil, planning to increase African (Mauritania, Guinea) supplies from 12% to 30% by 2030.
②Supply Chain Reshaping: Chinese steelmakers hold a 35% stake in Guinea's Simandou project, an "upstream control" model that may redefine traditional trade flows.
③Impact of Green Shipping: The IMO's new carbon emission regulations may optimize traditional routes post-2025, while drought in the Panama Canal has already driven some U.S. East Coast steelmakers to source from West Africa.
④RCEP Effect: Australia's iron ore export tariffs to China have dropped to zero, while members like Indonesia are leveraging the agreement to boost semi-finished exports (pellet exports to China grew 45% in 2023).
V. Future Outlook and Recommendations
Looking ahead, global iron ore trade flows will likely follow three major trends:
1.Rising resource nationalism may lead to more export restrictions (e.g., Indonesia's planned ban on raw ore exports from 2024);
2.Low-carbon smelting technologies will increase premiums for high-grade ores, potentially reinforcing the dominance of Australia and Brazil;
3.Steel capacity expansion along China's Belt and Road Initiative (e.g., Vietnam's Hoa Phat Dung Quat Steel, India's Tata new plant) will create new regional trade hubs.
For industry participants, we recommend:
*Importing countries should diversify supply sources, limiting dependence on any single supplier to below 30%;
*Exporters must invest in port infrastructure to accommodate Valemax-class vessels;
*Traders could explore arbitrage opportunities in niche markets like Indian pellets or Russian concentrates.
Additionally, close monitoring of the Carbon Border Adjustment Mechanism (CBAM) and proactive planning for low-carbon supply chains are advised.