You can contact us through the following ways, or you can directly register to experience our daas system.
USA trade data encompasses a vast array of statistics that detail the import and export activities of the United States. This data is meticulously collected and updated, providing insights into the economic interactions between the U.S. and its global trading partners. It includes information on trade balances, tariffs, and the classification of goods, which is accessible through user-friendly interfaces like the USITC DataWeb and Census Bureau's platforms. These resources are invaluable for businesses, researchers, and policymakers who seek to understand market trends and the impact of trade policies.
Register to viewComprehensive Trade Flow Analysis
Market Demand Identification
Competitive Intelligence
Supply Chain Optimization
Regulatory Compliance
Economic Health Indicator
Top Export Partners (2023)
Canada (17.5%)
Mexico (16%)
China (7.3%)
Netherlands (4.1%)
Germany (3.8%)
Japan (3.8%)
United Kingdom (3.7%)
South Korea (3.2%)
Brazil (3.1%)
France (2.9%)1.
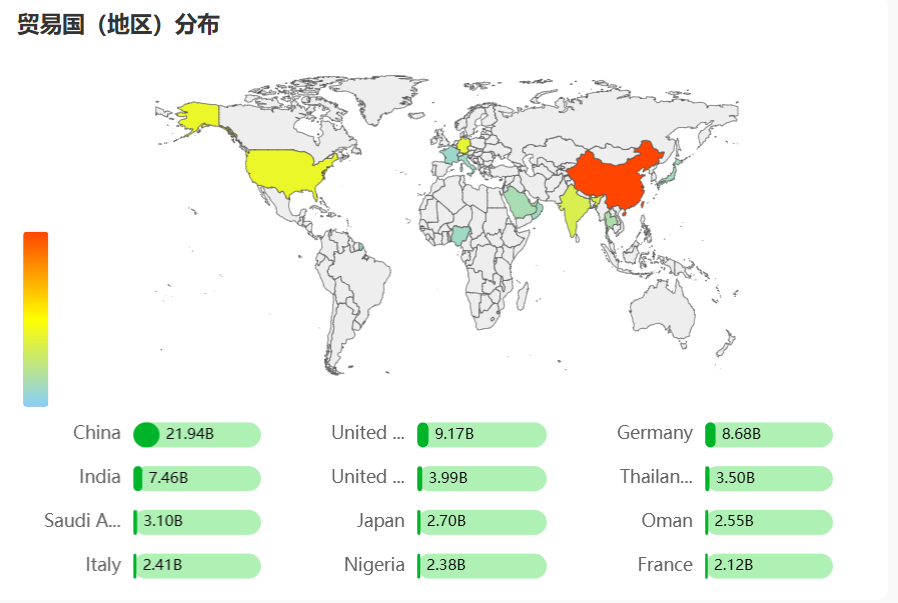
Top Import Partners (2023)
China (17.2%)
Mexico (14.8%)
Canada (12.8%)
Japan (5.4%)
Germany (4.8%)
South Korea (3.9%)
Vietnam (3.6%)
United Kingdom (3.2%)
India (3.1%)
Ireland (2.9%)
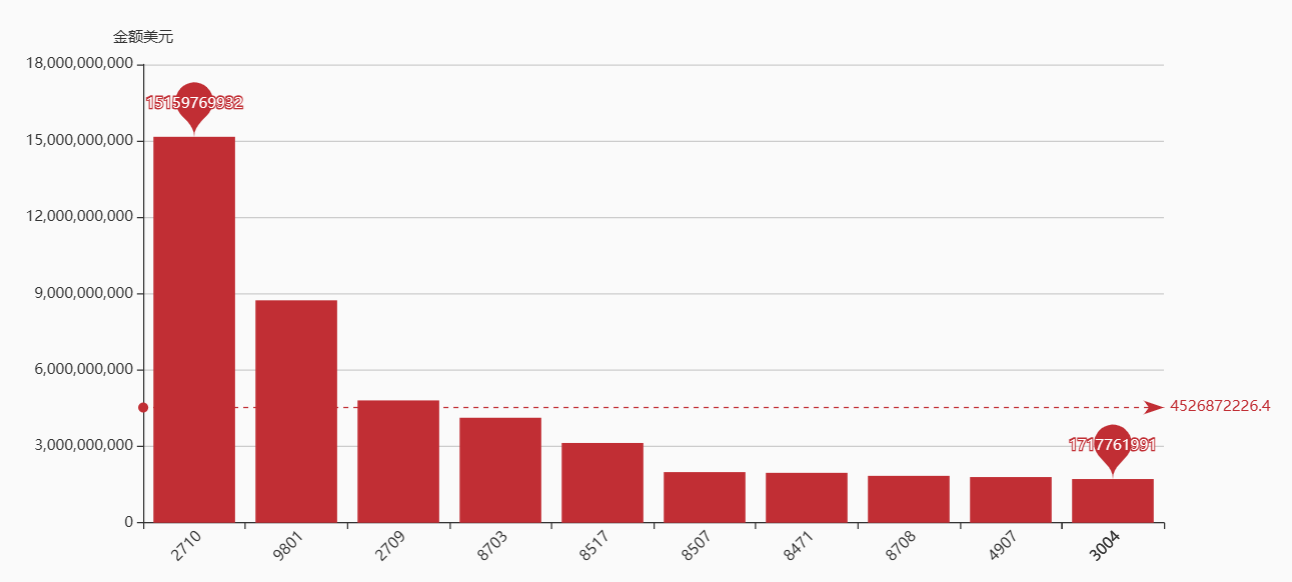
Mineral Fuels including Oil: $323.2 billion (16% of total exports)
Machinery including Computers: $233 billion (11.5%)
Electrical Machinery and Equipment: $200.7 billion (9.9%)
Vehicles: $152.8 billion (7.6%)
Aircraft and Spacecraft: $124.9 billion (6.2%)
Optical, Technical, and Medical Apparatus: $105.1 billion (5.2%)
Plastics and Plastic Articles: $74.3 billion (3.7%)
Pharmaceuticals: $72.3 billion (3.6%)
Organic Chemicals: $67.8 billion (3.4%)
Iron and Steel: $54.2 billion (2.7%)


Follow us to get the latest trade data information