You can contact us through the following ways, or you can directly register to experience our daas system.
Uganda's trade data reflects a dynamic economy with diverse export and import activities. In 2020, Uganda exported goods worth approximately $4.15 billion, including a variety of agricultural products, while imports totaled around $8.25 billion, indicating a trade deficit. The country has a range of export procedures for commodities like fruits, vegetables, and dairy, tailored to support first-time traders. Uganda's trade portal provides comprehensive information on market dynamics, regulatory requirements, and export-import procedures, serving as a crucial resource for traders and businesses.
Register to viewDetailed Trade Flow Analysis
Market Demand Identification
Competitive Intelligence
Supply Chain Optimization
Regulatory Compliance
Economic Health Indicator
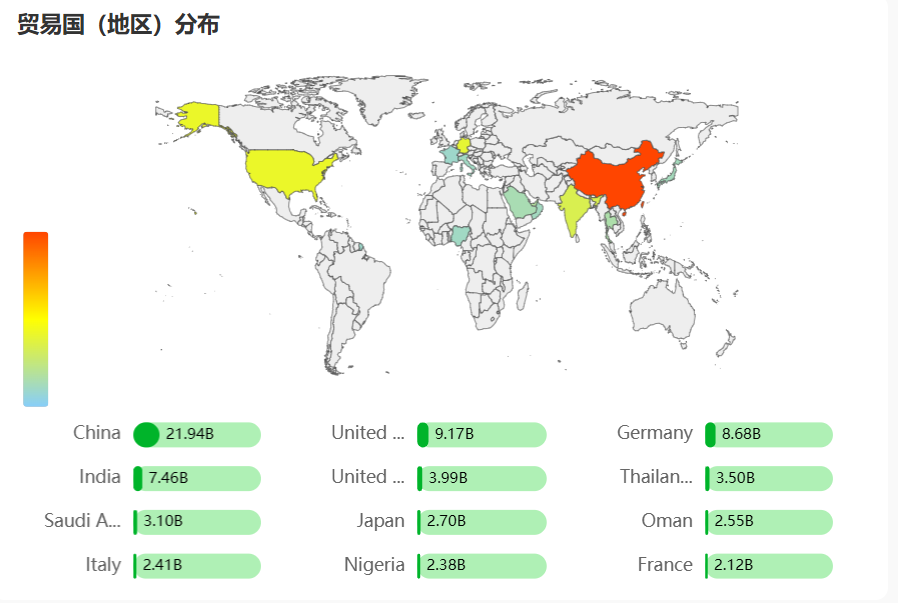
Top Import Partners (2021)
China (16%)
India (11.1%)
Kenya (9.12%)
Tanzania (8.88%)
United Arab Emirates (5.96%)
Japan (4.11%)
Saudi Arabia (3.29%)
South Africa (2.64%)
Gambia (2.54%)
Zimbabwe (2.43%)
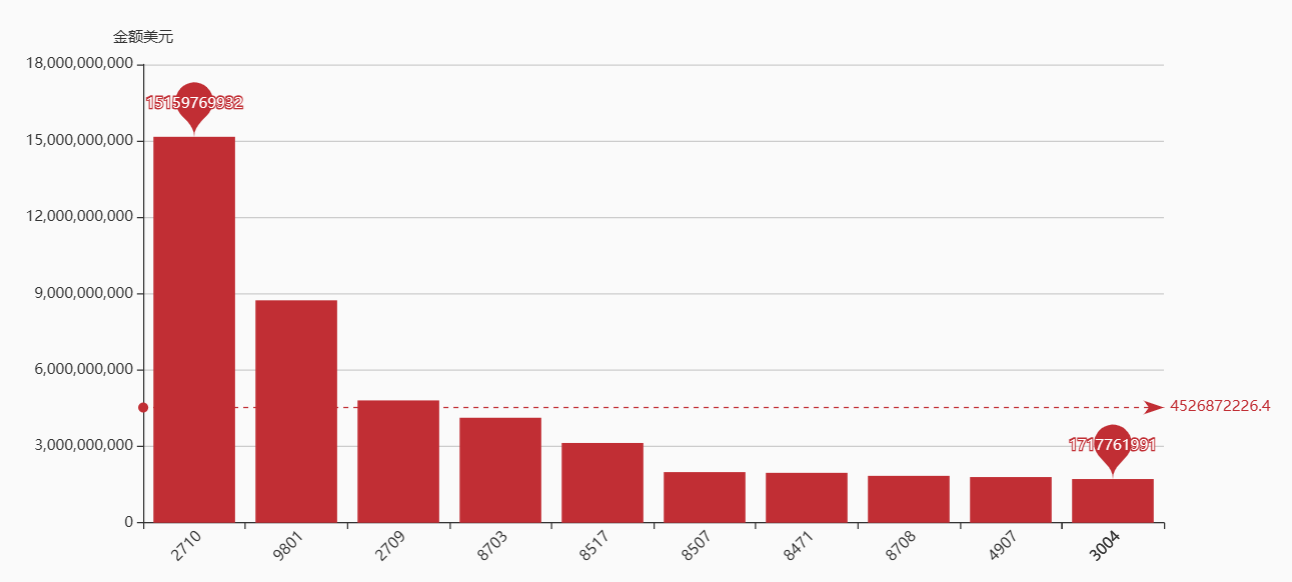
Here are Uganda’s top 10 trade industries based on their export values:
Coffee and Spices: $864.3 million (39% of total exports)
Gems and Precious Metals: $307.5 million (13.9%)
Fish: $139.4 million (6.3%)
Dairy, Eggs, and Honey: $102.5 million (4.6%)
Live Trees, Plants, and Cut Flowers: $78.3 million (3.5%)
Pharmaceuticals: $63.1 million (2.8%)
Wood: $58.9 million (2.7%)
Oil Seeds: $52.1 million (2.4%)
Cocoa: $50.4 million (2.3%)
Sugar and Sugar Confectionery: $49.2 million (2.2%)


Follow us to get the latest trade data information