You can contact us through the following ways, or you can directly register to experience our daas system.
Rwanda's trade data reflects a dynamic economy with a growing import and export sector. In the first quarter of 2024, the country's total trade amounted to approximately $2.38 billion, marking a significant increase from the previous year. The nation's exports include a diverse range of products, contributing to a robust domestic economy and offering insights into Rwanda's trade relationships and market trends.
Register to viewComprehensive Trade Flow Analysis
Market Demand Identification
Competitive Intelligence
Supply Chain Optimization
Regulatory Compliance
Economic Health Indicator
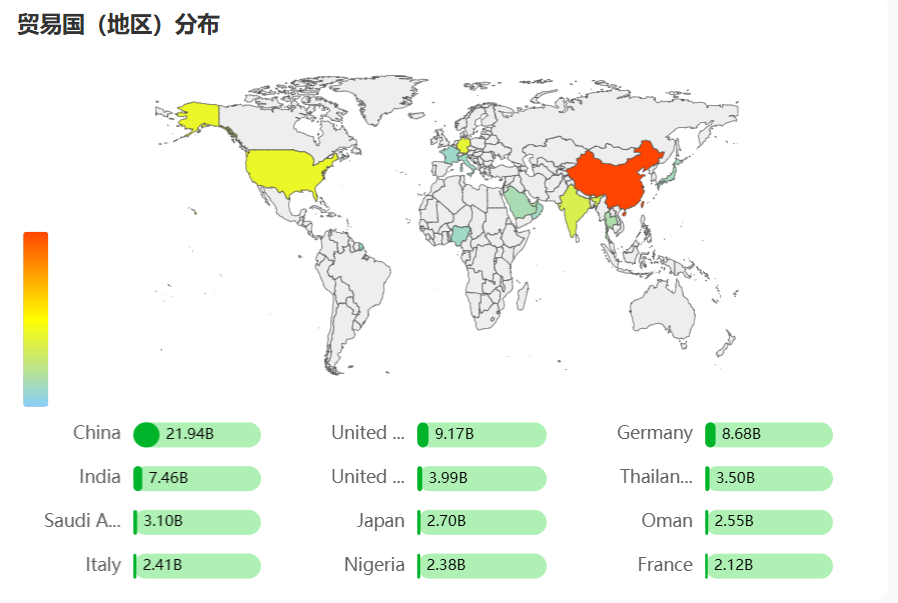
Top Export Partners (2022)
United Arab Emirates (32.2%)
Democratic Republic of the Congo (25.4%)
Thailand (8.1%)
United States (6.9%)
Ethiopia (6.2%)
Pakistan (5.3%)
Switzerland (4.1%)
Germany (3.7%)
Belgium (3.2%)
China (2.9%)12.
Top Import Partners (2022)
China (23.9%)
Tanzania (18.1%)
Kenya (10.2%)
United Arab Emirates (9.6%)
India (8.4%)
United States (6.3%)
Japan (5.1%)
Germany (4.7%)
South Africa (4.3%)
Turkey (3.4%)
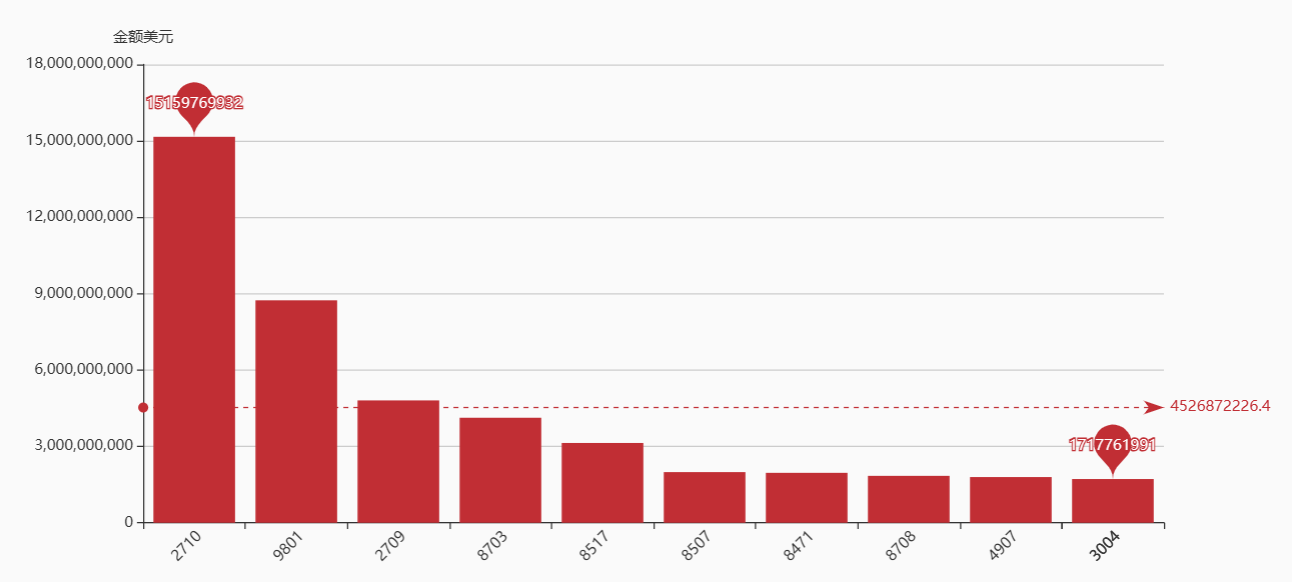
Coffee, Tea, and Spices: $556 million (38.7% of total exports)
Gems and Precious Metals: $456.2 million (31.8%)
Iron and Steel: $71.3 million (5%)
Milling Products, Malt, and Starches: $59.2 million (4.1%)
Miscellaneous Manufactured Articles: $58.7 million (4.1%)
Cereal/Milk Preparations: $43.4 million (3%)
Salt, Sulphur, Stone, and Cement: $41.7 million (2.9%)
Vegetables: $39.5 million (2.7%)
Animal/Vegetable Fats and Oils: $37.8 million (2.6%)
Fish and Seafood: $35.2 million (2.4%)


Follow us to get the latest trade data information