You can contact us through the following ways, or you can directly register to experience our daas system.
Kenya's trade data reflects its economic activities in exports and imports. In 2022, Kenya was ranked as the world's 115th exporter, with tea, cut flowers, and coffee being its top exports. The United States, Uganda, and Pakistan were among the top destinations for Kenyan products. On the import side, Kenya's main imports included refined petroleum and palm oil, primarily from China and the United Arab Emirates. This trade data highlights Kenya's involvement in global trade and its key economic sectors.
Register to viewComprehensive Trade Flow Analysis
Market Demand Identification
Competitive Intelligence
Supply Chain Optimization
Regulatory Compliance
Economic Health Indicator
Top Export Partners (2022)
Uganda (13.2%)
United States (9.8%)
Netherlands (6.8%)
Pakistan (6.4%)
United Kingdom (5.3%)
Tanzania (4.8%)
United Arab Emirates (4.5%)
Rwanda (4.3%)
Egypt (3.9%)
Germany (3.2%)12.
Top Import Partners (2022)
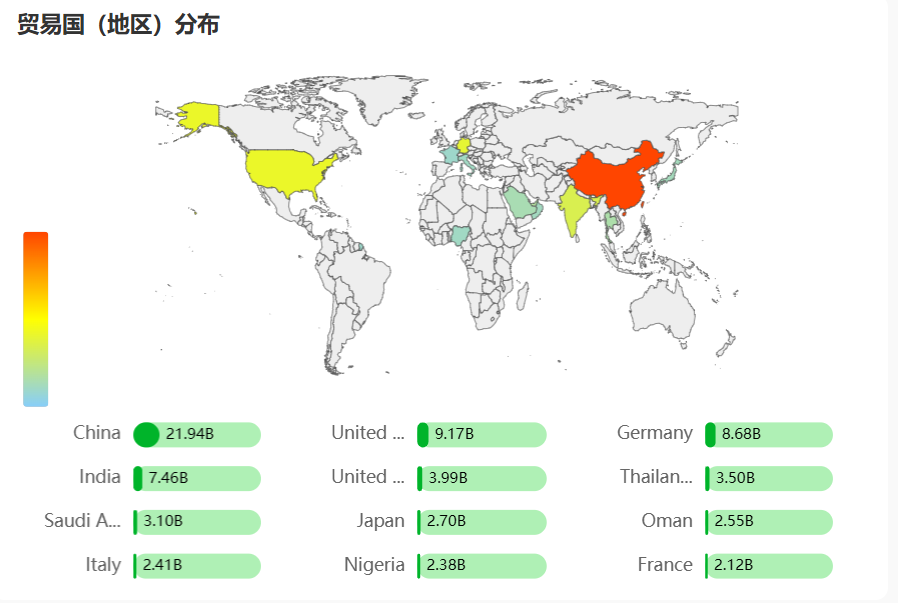
China (22.5%)
India (13.1%)
United Arab Emirates (8.9%)
Saudi Arabia (7.4%)
Japan (5.6%)
South Africa (4.8%)
United States (4.2%)
Germany (3.9%)
Malaysia (3.5%)
United Kingdom (3.1%)
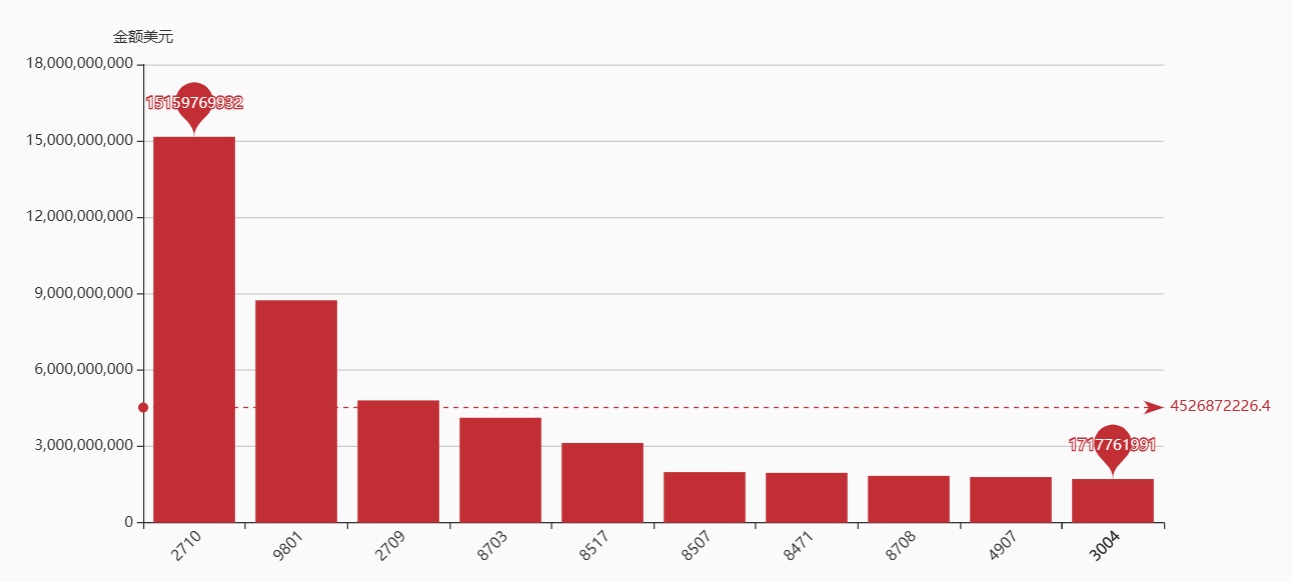
Coffee, Tea, and Spices: $1.6 billion (22.7% of total exports)
Live Trees, Plants, and Cut Flowers: $731.3 million (10.1%)
Mineral Fuels including Oil: $368.4 million (5.1%)
Fruits and Nuts: $246.1 million (3.4%)
Animal/Vegetable Fats, Oils, and Waxes: $226.3 million (3.1%)
Vegetables: $222 million (3.1%)
Salt, Sulphur, Stone, and Cement: $213.4 million (3%)
Ores, Slag, and Ash: $203.9 million (2.8%)
Iron and Steel: $187 million (2.6%)
Clothing and Accessories (not knit or crochet): $185 million (2.6%)


Follow us to get the latest trade data information