You can contact us through the following ways, or you can directly register to experience our daas system.
The Democratic Republic of the Congo (DRC) has a vibrant trade profile, characterized by significant exports and imports. In 2022, the DRC's exports were valued at $28.5 billion, with refined copper, cobalt, and copper ore being the top exports. China is the primary export destination, accounting for a substantial portion of the trade. On the import side, the DRC mainly brings in refined petroleum, sulfur, and delivery trucks, with China again being the major import source. The DRC's trade activities are crucial for its economy, representing a high percentage of its GDP.
Register to view1. Comprehensive Trade Flow Analysis
2. Market Demand Identification
3. Competitive Intelligence
4. Supply Chain Optimization
5. Regulatory Compliance
6. Economic Health Indicator
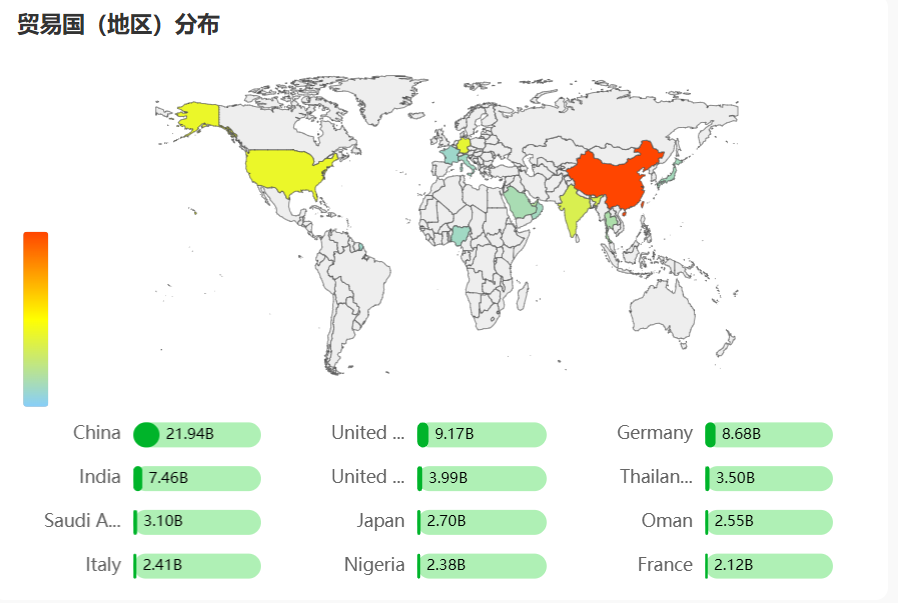
In 2022, the Democratic Republic of the Congo’s top trading partners for exports were:
China: $15.6 billion
Singapore: $1.36 billion
United Arab Emirates: $1.3 billion
Hong Kong: $1.24 billion
Tanzania: $1.17 billion
For imports, the main partners were:
China: $5.06 billion
Zambia: $1.51 billion
South Africa: $1.47 billion
United Arab Emirates: $734 million
India: $680 million
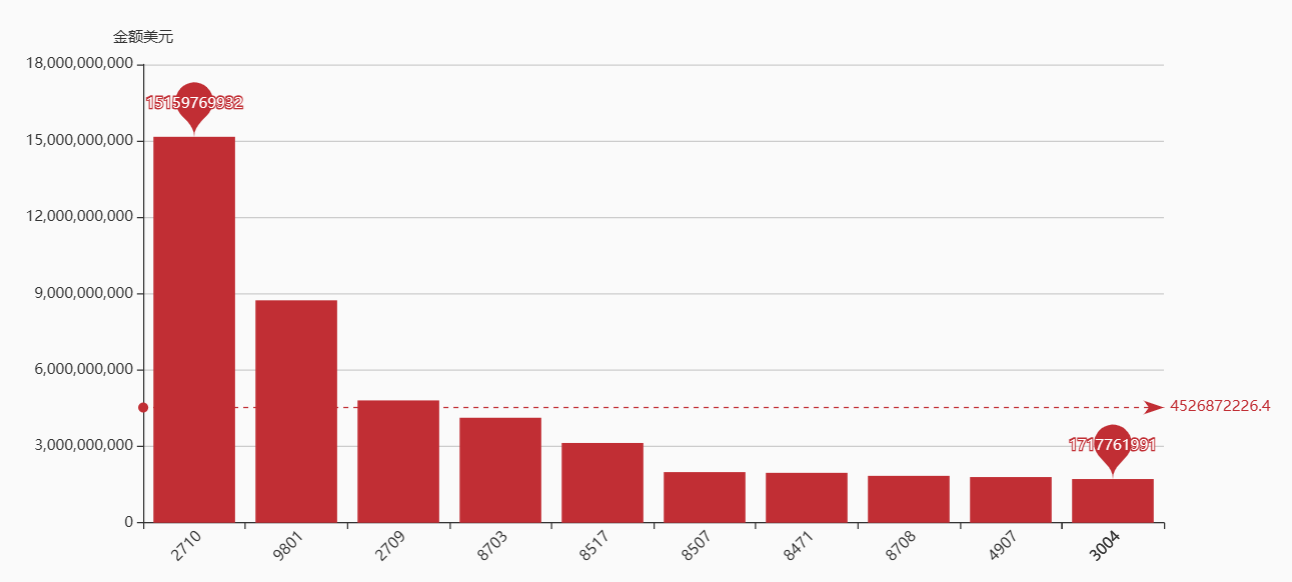
In 2022, Congo’s top trade industries based on export value were:
Copper: $16.8 billion (57% of total exports)
Inorganic chemicals: $8.2 billion (27.6%)
Ores, slag, ash: $3.1 billion (10.7%)
Gems, precious metals: $858.1 million (2.9%)
Other base metals: $159 million (0.5%)
Cocoa: $89.9 million (0.3%)
Wood: $68.6 million (0.2%)
Zinc: $35.8 million (0.1%)
Coffee, tea, spices: $31.2 million (0.1%)
Vehicles: $25.6 million (0.1%)


Follow us to get the latest trade data information