You can contact us through the following ways, or you can directly register to experience our daas system.
Chile's trade data reflects its strong economic ties with global partners. In 2022, Chile was the world's largest exporter of copper ore and refined copper, with significant exports also in carbonates, fish fillets, and raw copper. The country's top export destinations include China, the United States, and Japan. On the import side, Chile's main purchases were refined petroleum, cars, and crude petroleum, primarily from China and the United States. Chile's trade activities are crucial for its economy, with exports and imports contributing significantly to the GDP.
Register to viewDetailed Trade Flow Analysis
Market Demand Identification
Competitive Intelligence
Supply Chain Optimization
Regulatory Compliance
Economic Health Indicator
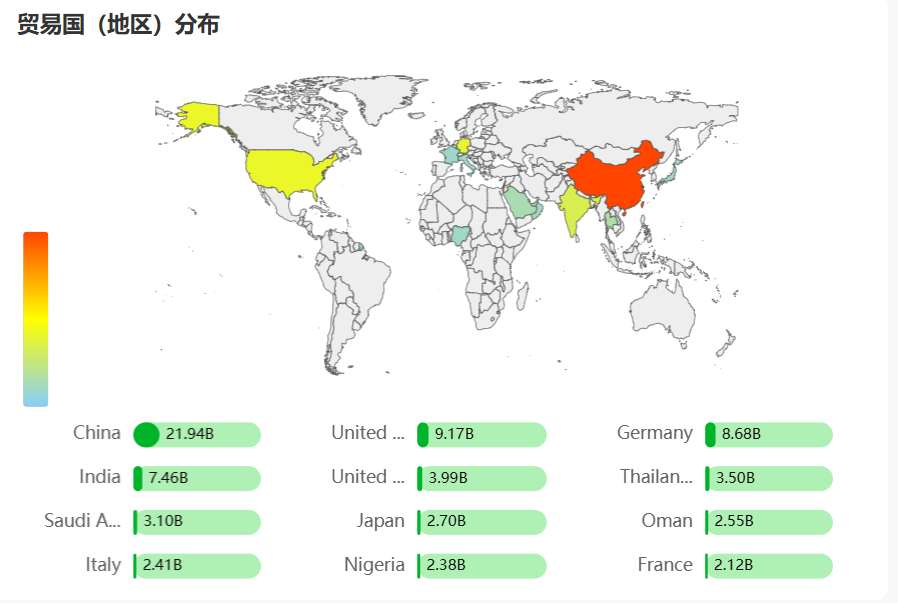
China: $38.9 billion (37.9% of total exports)
United States: $15.6 billion (15.2%)
Japan: $7.8 billion (7.6%)
South Korea: $6.1 billion (6%)
Brazil: $4.9 billion (4.8%)
Netherlands: $2.7 billion (2.6%)
Peru: $2.2 billion (2.1%)
Mexico: $1.9 billion (1.8%)
Taiwan: $1.6 billion (1.5%)
Spain: $1.5 billion (1.5%)
Ores, slag, and ash: $28.6 billion (28.5% of total exports)
Copper: $20.4 billion (20.4%)
Inorganic chemicals: $10.2 billion (10.2%)
Fish: $7.3 billion (7.3%)
Fruits and nuts: $6.7 billion (6.7%)
Woodpulp: $2.7 billion (2.7%)
Wood: $2.2 billion (2.2%)
Machinery including computers: $1.8 billion (1.8%)
Beverages, spirits, and vinegar: $1.6 billion (1.6%)
Gems and precious metals: $1.6 billion (1.5%)


Follow us to get the latest trade data information