You can contact us through the following ways, or you can directly register to experience our daas system.
In-Depth Trade Flow Insights
Market Demand Identification
Competitive Intelligence
Supply Chain Optimization
Regulatory Compliance
Economic Health Indicator
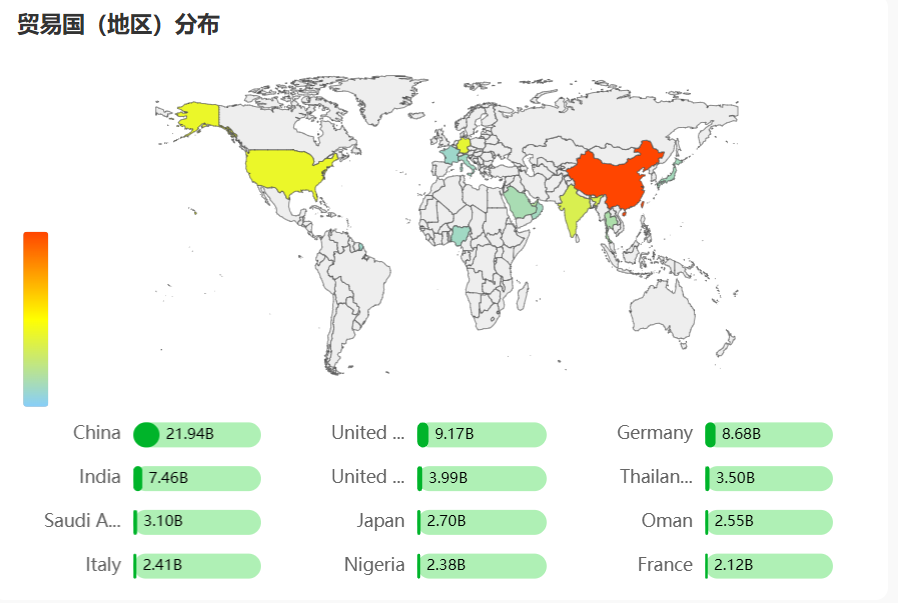
United States: $25.3 billion (41.3% of total exports)
China: $13.8 billion (22.1% of total imports)
Mexico: $6.72 billion (11%)
Netherlands: $2.18 billion (3.6%)
Panama: $1.15 billion (1.9%)
Belgium: $1.13 billion (1.8%)
Honduras: $3.82 billion (6.2% of internal trade)
El Salvador: $3.8 billion (6.2% of internal trade)
Nicaragua: $3.11 billion (5.1% of internal trade)
Guatemala: $2.85 billion (4.7% of internal trade)
Medical Instruments: $5.69 billion (most exported product category in 2023)
Coffee: $3.48 billion
Bananas: $3.2 billion
Palm Oil: $2.9 billion
Sugar: $2.5 billion
Knit or Crochet Clothing and Accessories: $2.1 billion
Fish and Seafood: $1.8 billion
Electrical Machinery and Equipment: $1.6 billion
Vegetables: $1.4 billion
Fruits and Nuts: $1.2 billion


Follow us to get the latest trade data information