You can contact us through the following ways, or you can directly register to experience our daas system.
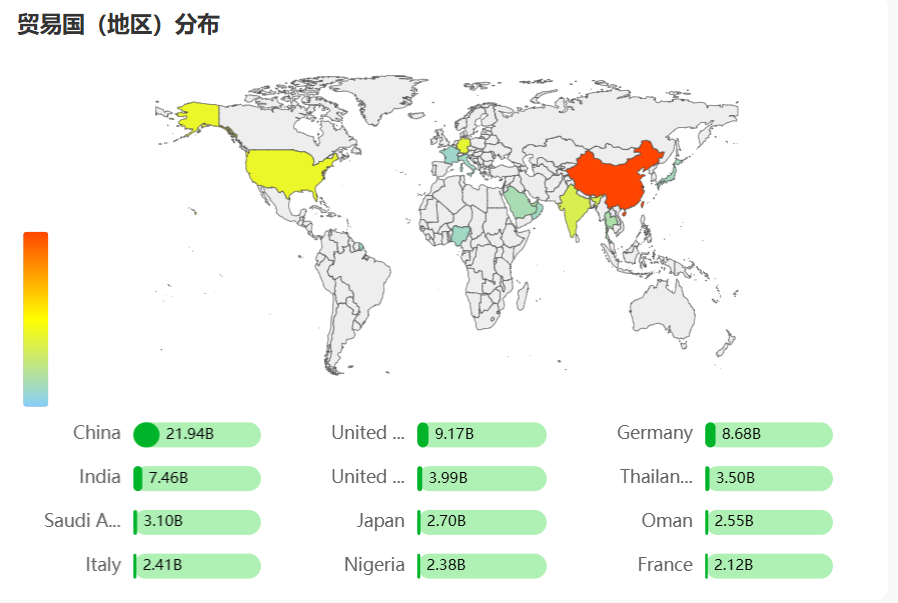
Belarus has a dynamic trade profile, with data indicating a balance between imports and exports. In 2021, Belarus exported goods worth approximately $39.89 billion and imported goods totaling about $41.81 billion, leading to a trade deficit. The country trades with a diverse range of partners and has a variety of exported and imported products. Notably, the trade growth rate of Belarus was 15.64%, surpassing the global average. This reflects the country's active engagement in international trade despite global economic fluctuations.
Register to viewDetailed Trade Flow Analysis
Market Demand Identification
Competitive Intelligence
Supply Chain Optimization
Regulatory Compliance
Economic Health Indicator
Exports:
Russia - 35.0%
Poland - 4.0%
Ukraine - 3.0%
Lithuania - 3.0%
Germany - 2.0%
China - 2.0%
Latvia - 1.6%
Netherlands - 1.0%
Kazakhstan - 0.6%
United States - 0.6%123.
Imports:
Russia - 28.6%
China - 8.1%
Germany - 3.6%
Ukraine - 3.4%
Poland - 2.5%
Lithuania - 2.0%
Italy - 1.8%
Turkey - 1.7%
Netherlands - 1.5%
United States - 1.4%
Exports:
Fertilizers - 21.1%
Mineral Fuels (including oil) - 11.2%
Wood - 10.2%
Animal/Vegetable Fats, Oils, Waxes - 5.7%
Meat - 5.2%
Vehicles - 4%
Iron and Steel - 4%
Dairy, Eggs, Honey - 3.9%
Furniture, Bedding, Lighting, Prefabricated Buildings - 3.4%
Electrical Machinery and Equipment - 2.7%12.
Imports:
Cars - 15%
Packaged Medicaments - 10%
Light Rubberized Knitted Fabric - 8%
Video Displays - 7%
Motor Vehicles Parts and Accessories - 6%
Petroleum Products - 5%
Machinery and Transport Equipment - 4%
Chemical Products - 3%
Manufactured Goods - 2%
Food and Live Animals - 2%


Follow us to get the latest trade data information